
| cutoff | accuracy | precision | sensitivity | f_meas | j_index | roc_auc |
|---|---|---|---|---|---|---|
| 0.38 | 0.741 | 0.504 | 0.477 | 0.491 | 0.311 | 0.742 |
| 0.50 | 0.751 | 0.564 | 0.204 | 0.300 | 0.148 | 0.742 |
Table 2: Model Performance Metrics
Masters thesis manuscript, August-September 2024
Patient attrition from routine treatment limits the effectiveness of hypertension control programs. This paper describes attrition from a hypertension control program in Nigeria with over 30,000 patients and 160,000 patient visits to treatment centres. A prediction model is then developed with registry data to predict 90-day dropout after each monthly visit, with discrimination of 0.74 AUROC but low sensitivity and precision. The value of employing this full model at different exchange rates versus different specifications or target outcome is discussed.
Hypertension, Prediction model, Nigeria
Hypertension is generally considered to be the leading modifiable risk factor for death and disability worldwide, causing an estimated 25,000 deaths per day.[[1]][2] According to the WHO, about 1.28 billion adults aged 30-79 years worldwide have hypertension, with most (78%) living in low- and middle-income countries (LMICs). [3] Although uncontrolled hypertension significantly increases risk for heart, brain, and kidney diseases, only 1 in 5 hypertensive adults (21%) have their blood pressure under control globally. Effective treatment coverage remains particularly elusive in LMICs, where only 1 in 10 hypertensive adults have achieved hypertension control.[3]
One of the main barriers to hypertension control is lack of adherence to prescribed treatment, including irregular attendance at antihypertensive services as well as long-term patient attrition.[[4]][5][6] There is a well-documented positive association between patient attendance regularity and blood pressure control.[7] Previous studies have shown gender, age, education, treatment duration, number of medications, presence of comorbidity, and medication adherence to be significantly associated with regularity in hypertension follow-up appointments in LMIC settings.[[6]][8] More broadly, a number of factors are known to generally influence primary health care access and utilization in LMICs, including (but not limited to) socioeconomic status, healthcare affordability, geographic proximity, social norms, health knowledge, and emergency contexts such as conflict or extreme weather events.[[9]][10][11]
In Nigeria, about 29% of 19.1 million hypertensive adults between 30-79 years are currently under treatment, while only 11% have their hypertension under control.[12] In 2020, the Federal Ministry of Health Nigeria, along with the WHO and an NGO called Resolve to Save Lives, announced the Nigeria Hypertension Control Initiative (NHCI) to integrate hypertension care and treatment into primary health care facilities in Ogun and Kano states[13] Since then, NHCI has registered more than 27,000 hypertensive adults at over 100 health facilities, where health workers provide routine low-cost antihypertensive services following a standardized treatment protocol.[14] Key patient data, such as blood pressure and hypertension medications, are documented at monthly follow up appointments by the care provider during each patient visit in an electronic hypertension registry. This registry is implemented as a mobile application connected to a District Health Information Software 2 (DHIS2) database. Although systematic studies have not yet been conducted to clarify barriers to care within NHCI, the hypertension registry has been used operationally to analyze patient status trends via facility-level DHIS2 dashboards, and to generate call sheets of patients who are “lost to follow up”. As of December 2023, DHIS2 dashboards showed national “lost to follow up” rates at about 70%, meaning most enrolled NHCI patients had not attended a follow-up appointment in the previous three months.
The NHCI hypertension registry is designed as a “minimal” electronic health record, primarily used for program monitoring rather than patient care management. However, the registry dataset comprises many patient-level variables previously associated with treatment regularity (e.g. gender, age, medications), and could be supplemented by other sources (e.g. indicators of environmental or economic stress) to provide an overview of individual- and population-level predictors of hypertension care attrition.
Previous studies have shown that PHCs across Nigeria are often manned by community extension workers, and relatively few are equipped with adequate training and medication supplies to provide antihypertensive services.[15] Other programs like NHCI have sought to purposefully expand anti-hypertensive services at PHCs, but have similarly suffered from lost to follow up. For example, the Hypertension Treatment in Nigeria Program (HTNP) in Federal Capital Territory of Nigeria found the three-month rolling average of the 37-day retention rate to be 40%, with gender, age, and new diagnosis of hypertension to be associated with patient retention.[16] Building on the HTNP findings, this study will investigate predictors of attrition from long term hypertension treatment in Nigeria.
Objective 1: To describe the patient population at NHCI treatment sites, in terms of baseline characteristics, total visits, and attrition rates.
Objective 2: To develop and internally validate a risk prediction model for per-opportunity risk of patient attrition (90 days with no previous visit).
All data for hypertension visits between January 1 2021 to June 30 2024 were exported from the Line List app of the NHCI’s DHIS2 instance in July 2024. The initial export of 172,689 visits included sensitive information like patient date of birth, phone number, and the DHIS2 enrollment ID. For data protection, before sharing with analysts, the date of birth was transformed into an Age at Registration variable, phone number was converted into a dummy variable, and enrollment ID was transformed into an internal export ID.
Visits meeting any of the following criteria were immediately removed from analysis set: Age at Registration below 18 or above 130; confirmed patient consent to record data not reported; hypertension was not confirmed; visits occurring outside of Ogun or Kano states. Visits for identical patients on the same date, totaling 3.7% of visit records, were deduplicated systematically (see supporting material).
The resulting dataset covers 30,712 patients and 163,694 hypertension service visits. Visits were recorded at 105 health facilities in 22 of 64 Local Governance Authorities (LGAs) of Kano and Ogun states. All analyses were conducted in R, with prediction models using the tidymodels framework. [17]
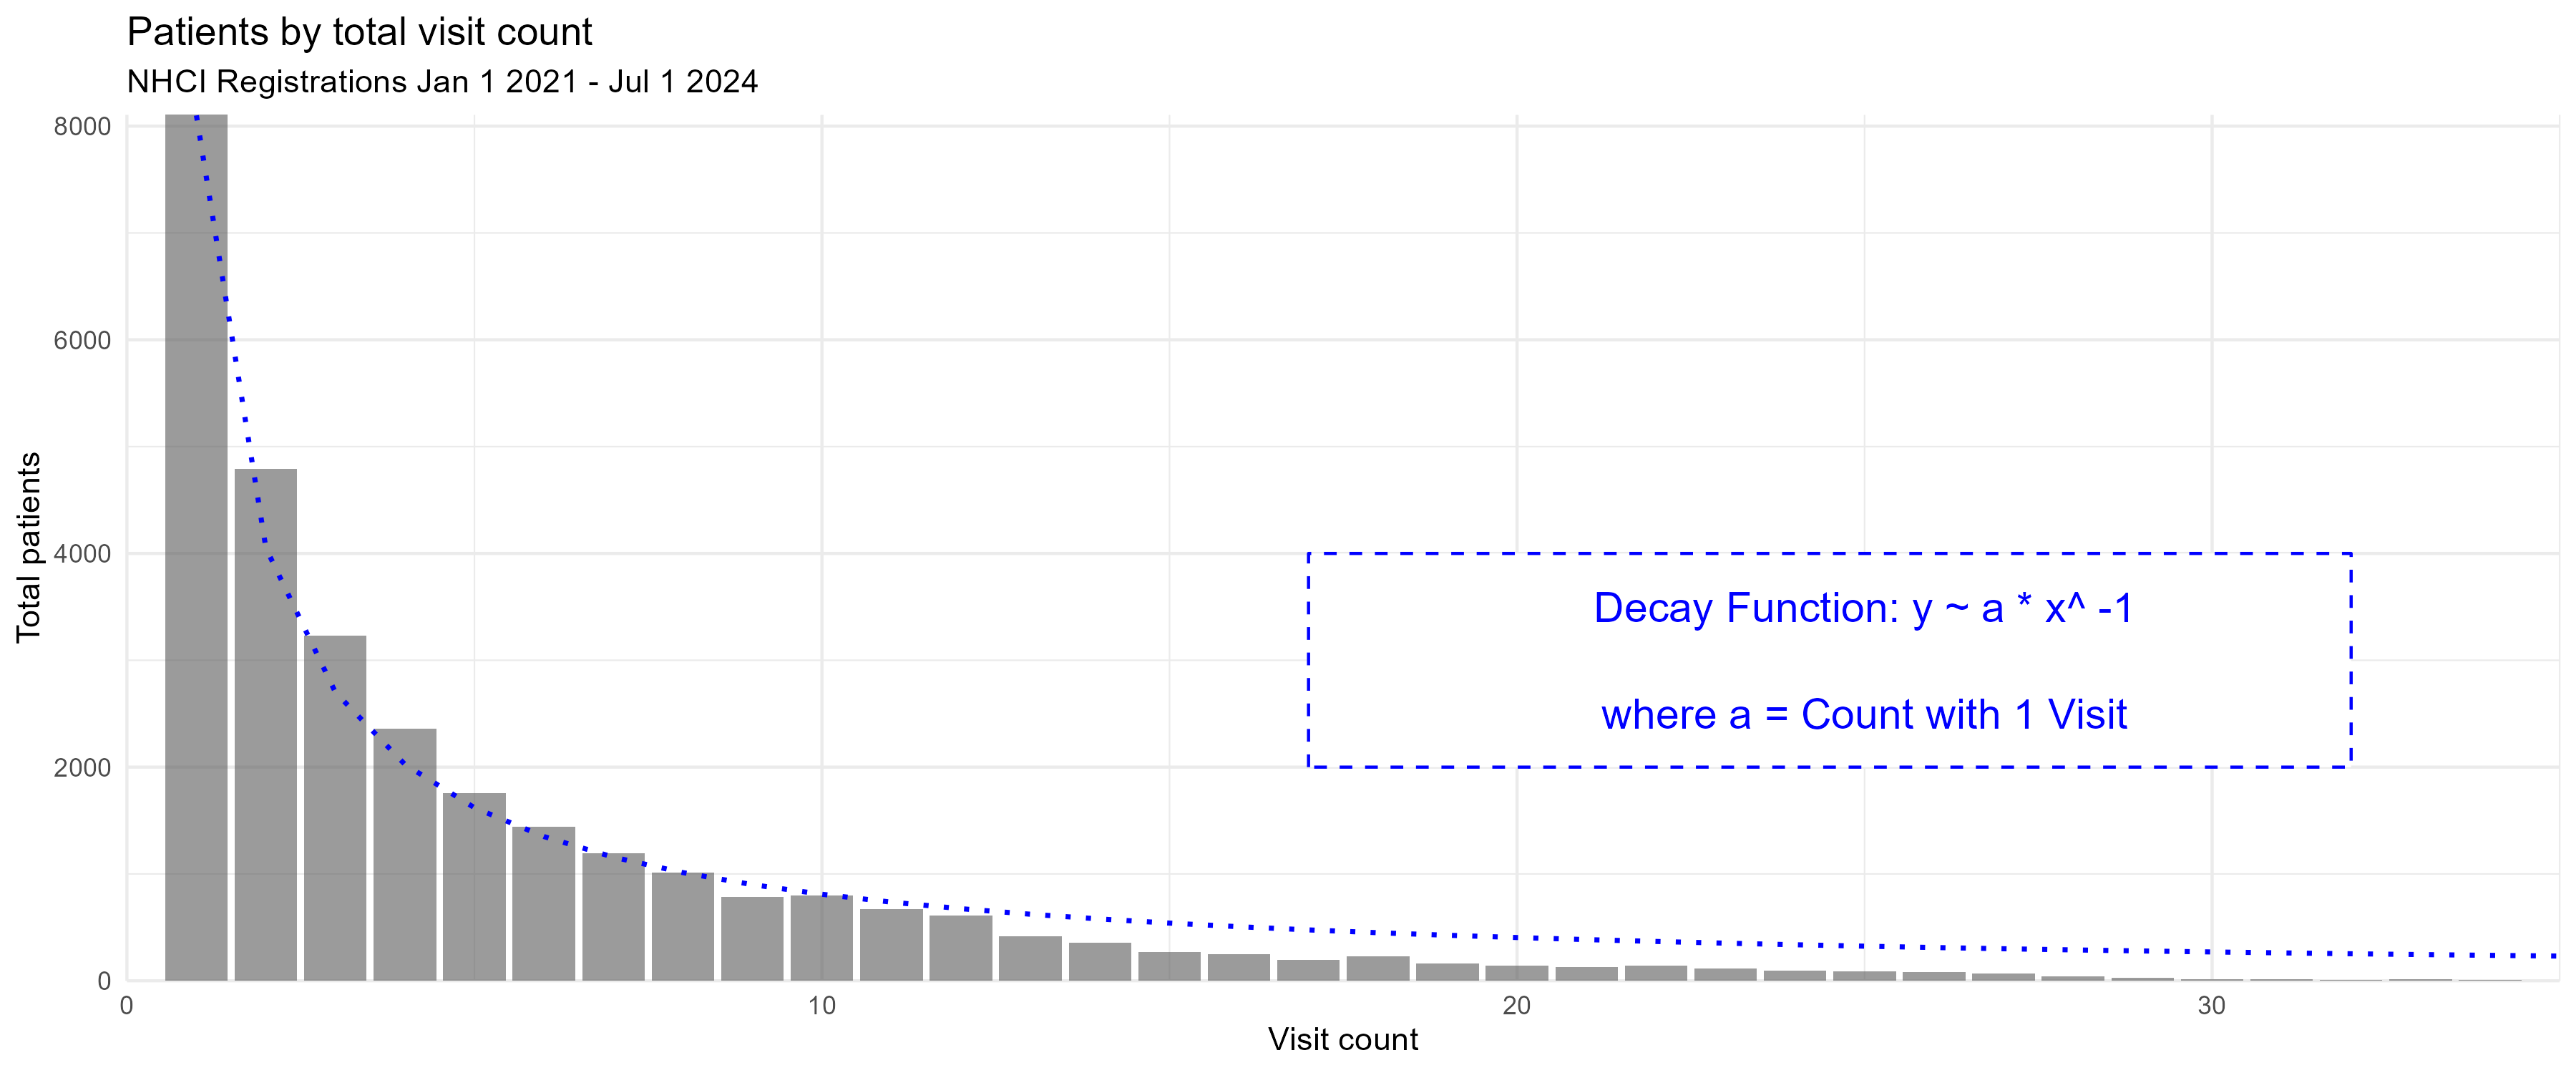
Before assessing attrition rates, the total number of visits per patient in this dataset gives a quick overview of delivery trends. By protocol, patients should be attending hypertension treatment on a continual monthly basis to receive medicine unless they are referred for more specialized care. However, 25% of all registered patients fail to attend any followup after the baseline visit. When plotting patients by total appointment count as in Figure 1, the trend continues monotonically, and can be approximated with an exponential decay y ~ a * x^-1, where a is the total registered patients with only one visit.
Baseline patient characteristics are presented in Table 1. Three quarters of patients are female, and 57% registered in Kano state. The mean number of visits per patient is 5.40.
Compared to patients who make at least one followup visit, patients who dropout after baseline are much more likely to come from Ogun State. They are slightly more likely to be Male and previously diagnosed, and less likely to have a phone number or a systolic blood pressure under 180 mm/hg.
Table 1 excludes those 2,485 patients from the dataset who registered before January 1, 2021 as their baseline visit data were not exported.
| >=1 Visits Post Baseline | 0 Visits Post Baseline | Overall | |
|---|---|---|---|
| (N=21183) | (N=7044) | (N=28227) | |
| sex | |||
| Female | 16005 (75.6%) | 5032 (71.4%) | 21037 (74.5%) |
| Male | 5171 (24.4%) | 2008 (28.5%) | 7179 (25.4%) |
| Missing | 7 (0.0%) | 4 (0.1%) | 11 (0.0%) |
| State | |||
| kn Kano State | 13042 (61.6%) | 2910 (41.3%) | 15952 (56.5%) |
| og Ogun State | 8141 (38.4%) | 4134 (58.7%) | 12275 (43.5%) |
| age | |||
| Mean (SD) | 53.7 (14.6) | 53.9 (15.6) | 53.8 (14.8) |
| Median [Min, Max] | 53.0 [18.0, 124] | 53.0 [18.0, 122] | 53.0 [18.0, 124] |
| previous_htn_treated | |||
| First time | 17400 (82.1%) | 5632 (80.0%) | 23032 (81.6%) |
| Was treated in the past | 3632 (17.1%) | 1323 (18.8%) | 4955 (17.6%) |
| Missing | 151 (0.7%) | 89 (1.3%) | 240 (0.9%) |
| sbp_baseline | |||
| normal | 182 (0.9%) | 43 (0.6%) | 225 (0.8%) |
| high or elevated (120-140) | 1293 (6.1%) | 302 (4.3%) | 1595 (5.7%) |
| very high [140-180) | 17547 (82.8%) | 5701 (80.9%) | 23248 (82.4%) |
| emergency [180-300) | 2082 (9.8%) | 951 (13.5%) | 3033 (10.7%) |
| error (>300 or < 50) | 13 (0.1%) | 5 (0.1%) | 18 (0.1%) |
| Missing | 66 (0.3%) | 42 (0.6%) | 108 (0.4%) |
| bp_systole_mmhg | |||
| Mean (SD) | 158 (17.9) | 161 (18.8) | 159 (18.1) |
| Median [Min, Max] | 158 [14.0, 400] | 160 [14.0, 400] | 159 [14.0, 400] |
| Missing | 66 (0.3%) | 42 (0.6%) | 108 (0.4%) |
| amlodipine_baseline | |||
| Amlodipine 10mg OD | 1802 (8.5%) | 802 (11.4%) | 2604 (9.2%) |
| Amlodipine 5mg OD | 19175 (90.5%) | 6158 (87.4%) | 25333 (89.7%) |
| Other drug | 3 (0.0%) | 0 (0%) | 3 (0.0%) |
| Missing | 203 (1.0%) | 84 (1.2%) | 287 (1.0%) |
| has_phone | |||
| 0 | 3994 (18.9%) | 1359 (19.3%) | 5353 (19.0%) |
| 1 | 17189 (81.1%) | 5685 (80.7%) | 22874 (81.0%) |
| has_supporter | |||
| 0 | 4217 (19.9%) | 1593 (22.6%) | 5810 (20.6%) |
| 1 | 16966 (80.1%) | 5451 (77.4%) | 22417 (79.4%) |
| total_patient_visits | |||
| Mean (SD) | 6.87 (5.72) | 1.00 (0) | 5.40 (5.57) |
| Median [Min, Max] | 5.00 [2.00, 45.0] | 1.00 [1.00, 1.00] | 3.00 [1.00, 45.0] |
As seen above, 25% of patients fail to return to their first follow up visit, but the attendance failure rate diminishes with each subsequent visit. The literature provides an abundance of terms to describe this phenomenon, including attendance nonadherence, treatment discontinuity (TD), lost to follow up (LTFU), dropout, and attrition. This paper refers to dropout as an endline outcome event, and attrition as the rate of dropout events per eligible patients.
A dropout event occurs for a patient on the date that 90 days have passed since their latest visit. The 90 day window is an operational norm used for routine program monitoring of blood pressure control and attendance on dashboards, and is thus practical as a cutoff for attrition rates and prediction. Dropout is also a one-time occurrence in this definition, although it should be noted that 17% of visits occur after 90 days of the previous visit. The odds of dropout at each appointment are 1.94 fold for patients who have previously been delayed more than 90 days and later returned, compared to those who never experienced a first dropout event.
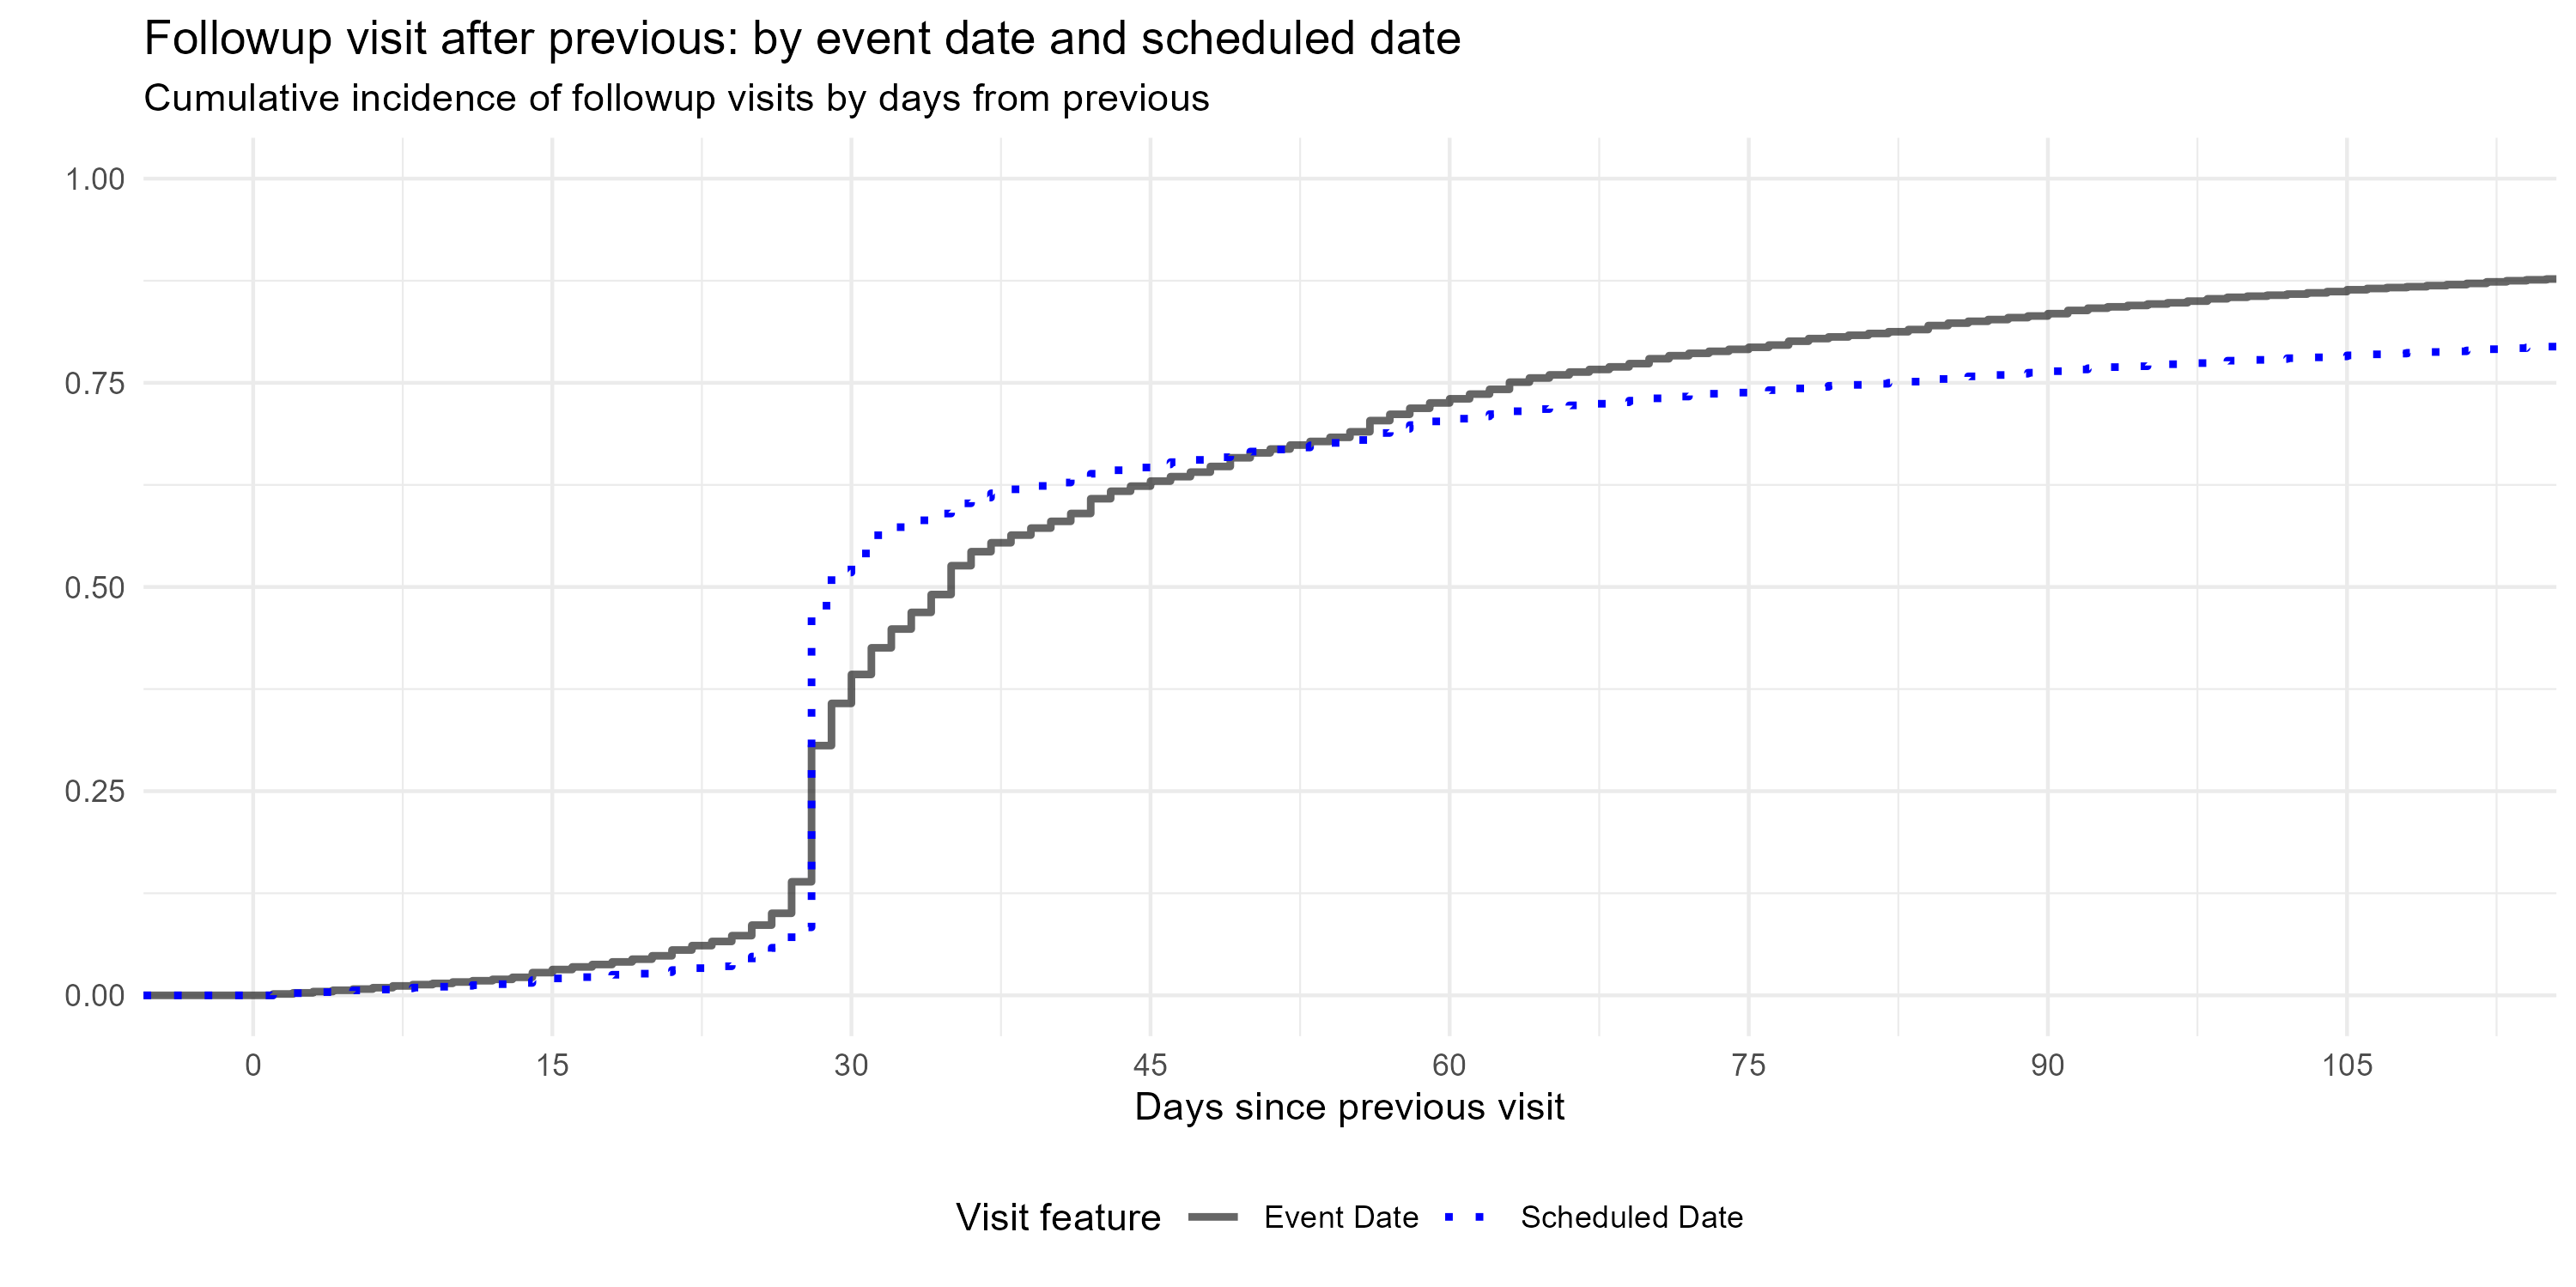
Each followup visit also has a scheduled date, which is the next appointment date set by the healthcare provider at the previous visit. As seen in Figure 2 , 53% of followup visits are scheduled to occur 27-36 days after the previous visit, with 38% falling precisely 28 days later (the system default setting). As defined by the event (visit) date, 44% of followup visits actually occur within that window.
The 27-36 day window is an optimal “timely return” as it would best support monthly blood pressure readings and transferring 30 days of medication per protocol. Thirty seven days is also the timely return deadline employed by Ye et al for their assessment of NHTP followup vistis post-baseline. [16]
Attrition rate is defined as the number of dropout events for a given time period divided by the number of “expected visits” from dropout-eligible patients within that time period. “Expected visits” includes all patients who had a non-censored visit 90 days before any day within the time period, and “dropout-eligible patients” who have not yet experienced a dropout event. Censored visits include visits when a patient was reported as died or transferred, as well as any visit after April 1 2024.
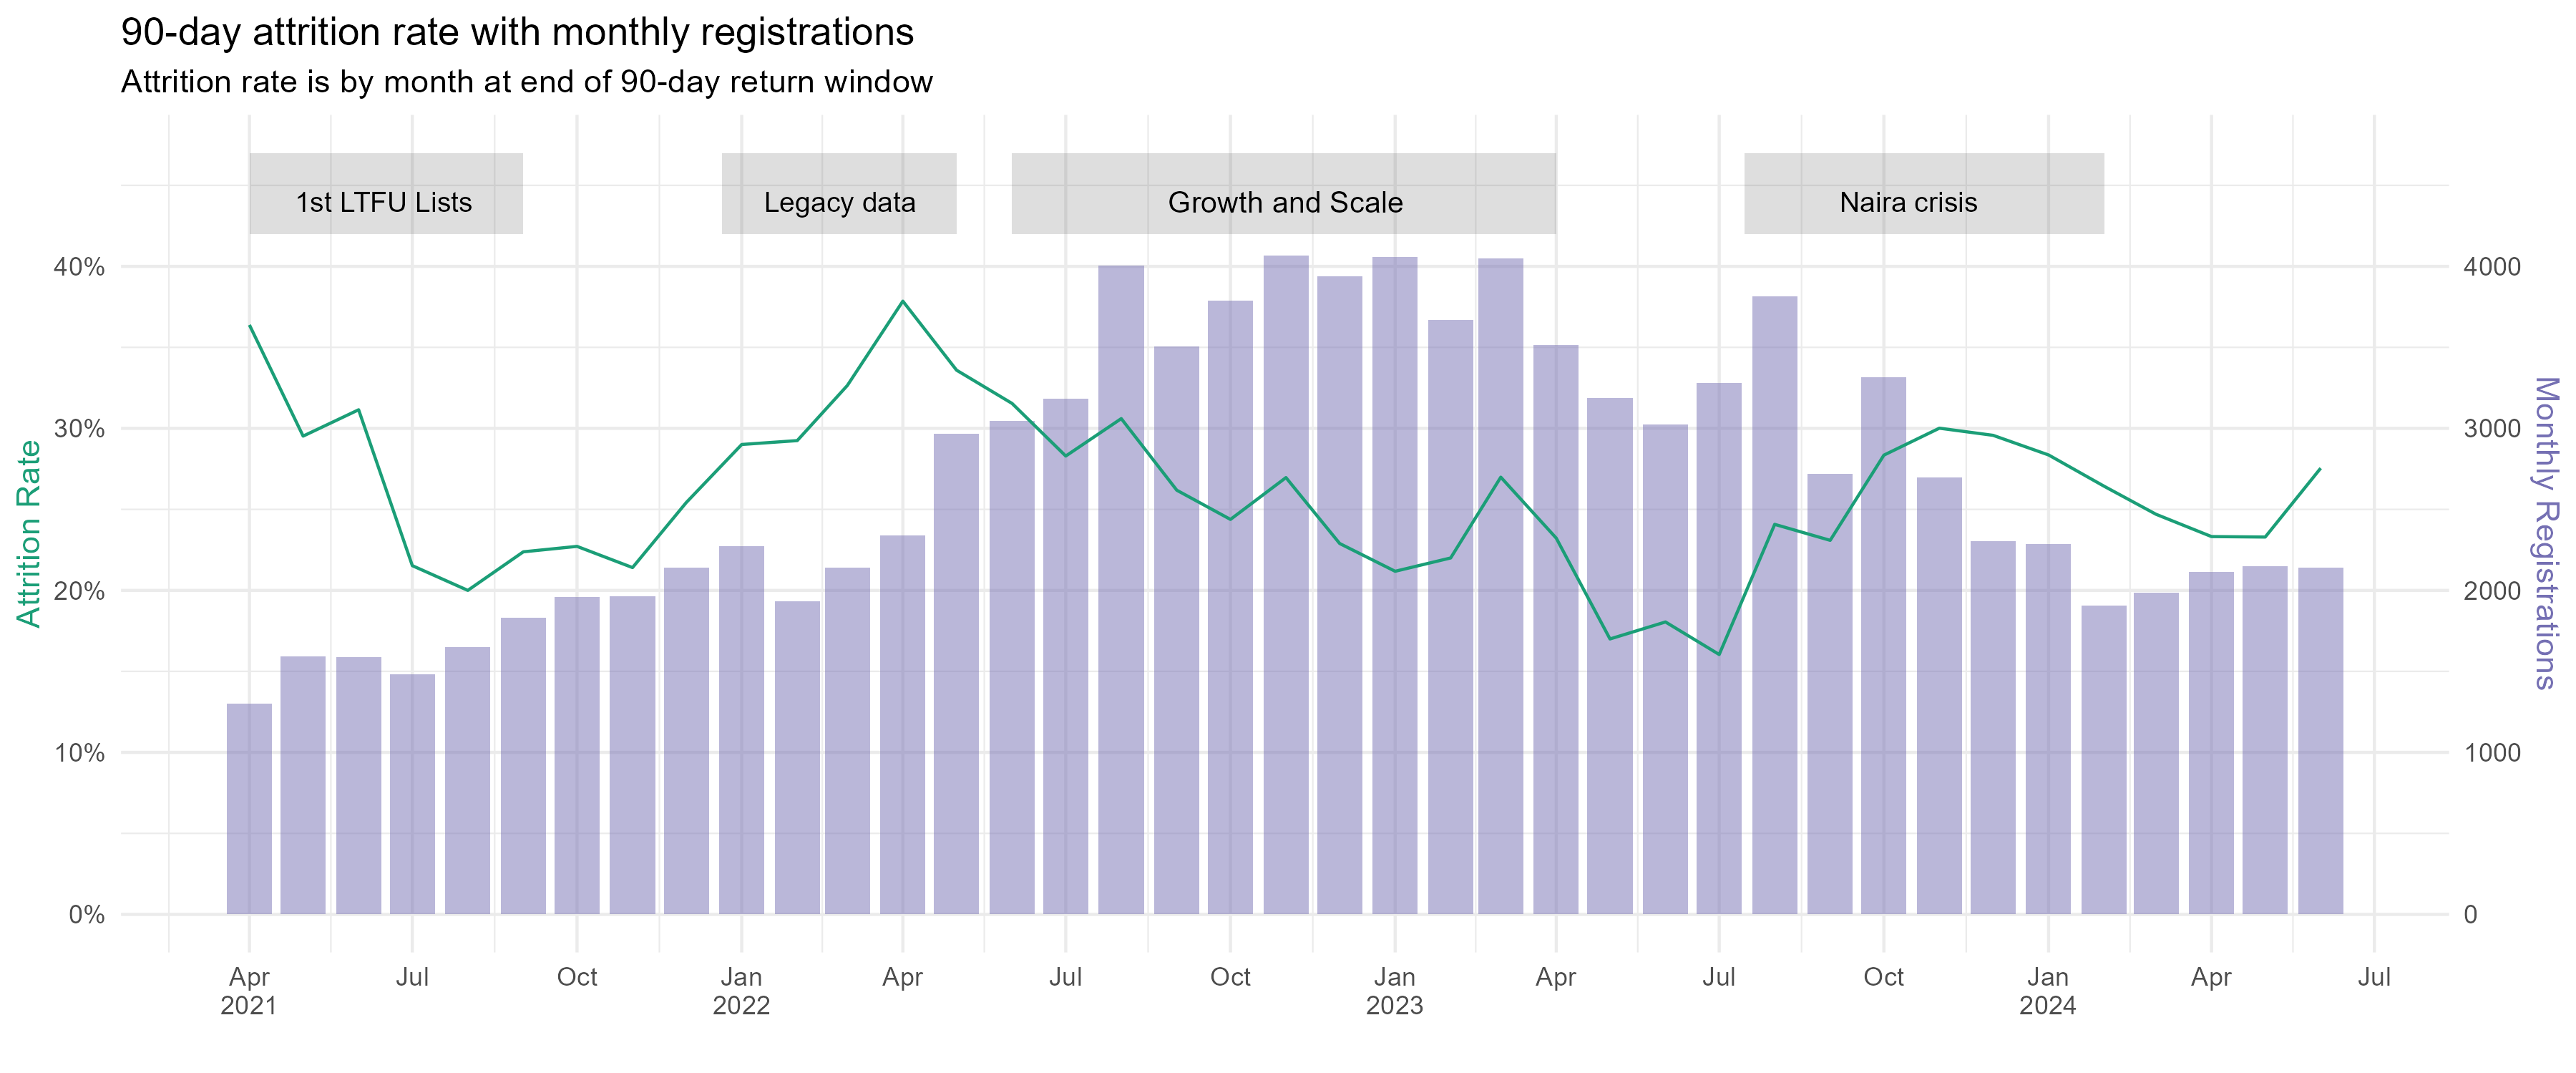
Defined this way, monthly attrition rates varied nationally, between 15-38%. Trends followed implementation landmarks. Producing LTFU call sheets for health facilities led to a reduction in attrition in early 2021 from 35% to 20%. Importing legacy data from paper based systems in February 2022 corresponded with an increase in attrition, while increasing registrations later in the year, along with performance dashboards, gradually lowered attrition. A 14-point spike in attrition is seen during second half of 2023. This aligns with an abrupt end of Nigeria’s oil subsidy and USD currency peg in May 2023, which together tripled petrol prices year on year, reportedly had cascading effects for healthcare access.[[18]][19] Lower registrations were also observed during this time period.
Demographic data were static for each patient, and included age at registration, sex, and supporter’s relationship to patient. Phone number on record, diabetes co-morbidity, previous hypertension treatment, and consent to send SMS reminders were each binary dummy variables. The basic clinical data were dynamic for each event, and included year and month of visit, LGA and State of visit, systolic blood pressure (SBP) in mmhg, diastolic blood pressure (DBP) in mmhg, and medications provided (one or more of hydrochlorothiazide, telmisartan, amlodipine, losartan, or “other”, a free text box).
Days of medication provided were imputed to be 30 days, except 804 visits where a multimonth dispensing pilot provided medication for 60 or 90 days.
Further, a set of calculated variables were added as candidate predictors. These included current appointment tally, age group, days since first visit, days from previous visit to current visit, mean and standard deviation of days between visits, any medication at visit (binary), and the monthly visit load (throughput) at the health facility. Change in SBP and DBP since baseline was calculated, as was a flag variable if SBP and DBP measures were blank.
Finally, variables were calculated to assess the patient’s step level within the hypertension protocol, and if the HCW provided the proper treatment.[14] For example, if this was the patient’s first visit, and blood pressure was >= 140/90, then step_1_need =1, and if they also received 5 mg of amlodipine at that visit, then step_1_met =1. Treatment was provided correctly at this first level more often for patients who return within 90 days (96%) than those who dropout after first visit (94%).
Slight seasonal patterns can be detected in attrition, with increases during dry season (October to April) and decreases in rainy season (April to September). Further, heat, rain, and extreme weather events have been found associated with attendance at primary healthcare, [[9]][20] and incorporating weather data improves appointment no-show prediction models.[21] Weather could also play a role in NHCI attendance during the timely window.
Centroid coordinates for each LGA were downloaded from grid3.org. [22] For each coordinate set, daily weather was pulled from the open-meteo.com API for January 1, 2021 to July 1, 2024. Variables included maximum temperature (C), maximum apparent temperature (with humidity), rainfall total (mm), and rainfall hours, which were all transformed into trailing 10-day averages.
Weather data was merged with the NHCI visit dataset based on the LGA of clinic and the visit date plus 37 days.
The price of fuel, both globally and domestically, affects the entire national economy in Nigeria, including the price of transportation, staple foods, healthcare, and in general the cost of living. As shown in Figure 3, registrations lowered and attrition coincided with a sharp increase in fuel and food prices in June 2023. Prices could therefore be an instrumental proxy for ability to access hypertension services.
The Famine Early Warning Systems Network (FEWS NET), sponsored by the US Agency for International Development, collects and shares data on food and staple good prices at local markets in Africa, which are used to assess food security. Weekly market price data for Kano and Lagos states were pulled from the FEWSNET API for January 1 2021 to April 1 2024 and reconfigured as a 10-day trailing average.[23] Market data were not available for Ogun State, but Lagos borders Ogun to the South, and has market data more consistent with national rates than other bordering states. The data cover prices in Naira of seven foods described as Nigerian staple foods by the Food and Agriculture Organization (millet, rice broken and milled, yellow and white maize, brown and white sorghum, yams). [24] The local pump price of diesel and gasoline, as well as the USD-Naira exchange rate were also included.
Market price data was merged with the NHCI dataset based on the State of clinic and the visit date plus 37 days.
Thus, these population-level indicators approximate local economic and weather conditions during the “timely return” window for each visit opportunity, and represent plausible acute risks for missing a monthly appointment. T-tests were conducted on each weather and market variable against 37-day attendance. Only six variables had a Cohen’s D effect size over 0.11, indicating a very weak effect: max daily temperature, rain hours, rain in millimeters, millet price, milled rice price, sorghum price. These six were selected as candidate predictors for 90 day dropout.
The goal is to predict dropout event within the 90 day window after each visit, given patient clinical history, plus weather and economic conditions during the timely visit window (27-36 days). As a binary outcome variable, a “90 day dropout” occurs at the latest visit observation before dropout incidence (i.e. dropout per-opportunity).
Before model training, the visit data received additional processing. All patients who registered prior to January 1, 2021 were removed, as were all patient visits occurring after a dropout event. Censored visits (where patient was reported as death or transfer, and any visits after May 1, 2024) were removed, while previous visits from patients with a censored visit were retained. Calendar month replaced the event date. For balance, both the patient tally of previous visits and monthly facility patient load were log transformed. All nominal predictors were transformed into dummy variables. All numeric variables with null values (e.g. SBP) were imputed with the global median. Age at registration was transformed into two natural splines. Finally, all predictors were centred to a mean of zero and scaled to have a standard deviation of one.
We employed logistic regression with LASSO regularization, assessed by 5-fold cross-validation.
First, a random sample of 20% of patients were partitioned and held out as a testing dataset.
The remaining data was then divided into five folds semi-randomly, as observations were grouped by patient ID and stratified by patient’s eventual dropout outcome. When a visit was sampled at random into Fold 1 Training Split 1, all visits for this patient went into Fold 1 Training Split 1. Grouping sampled observations by patient prevents train-test contamination whereby a patient’s baseline visit is used in a assessment split and followup visits are used in remaining training splits. For balance across the folds, sampling was stratified, so the same number of patients with a dropout event would go into each fold. While the folds are equally sized, grouped resampling by patient results in some differences in size for each fold’s assessment split (max 16156, min 15567).
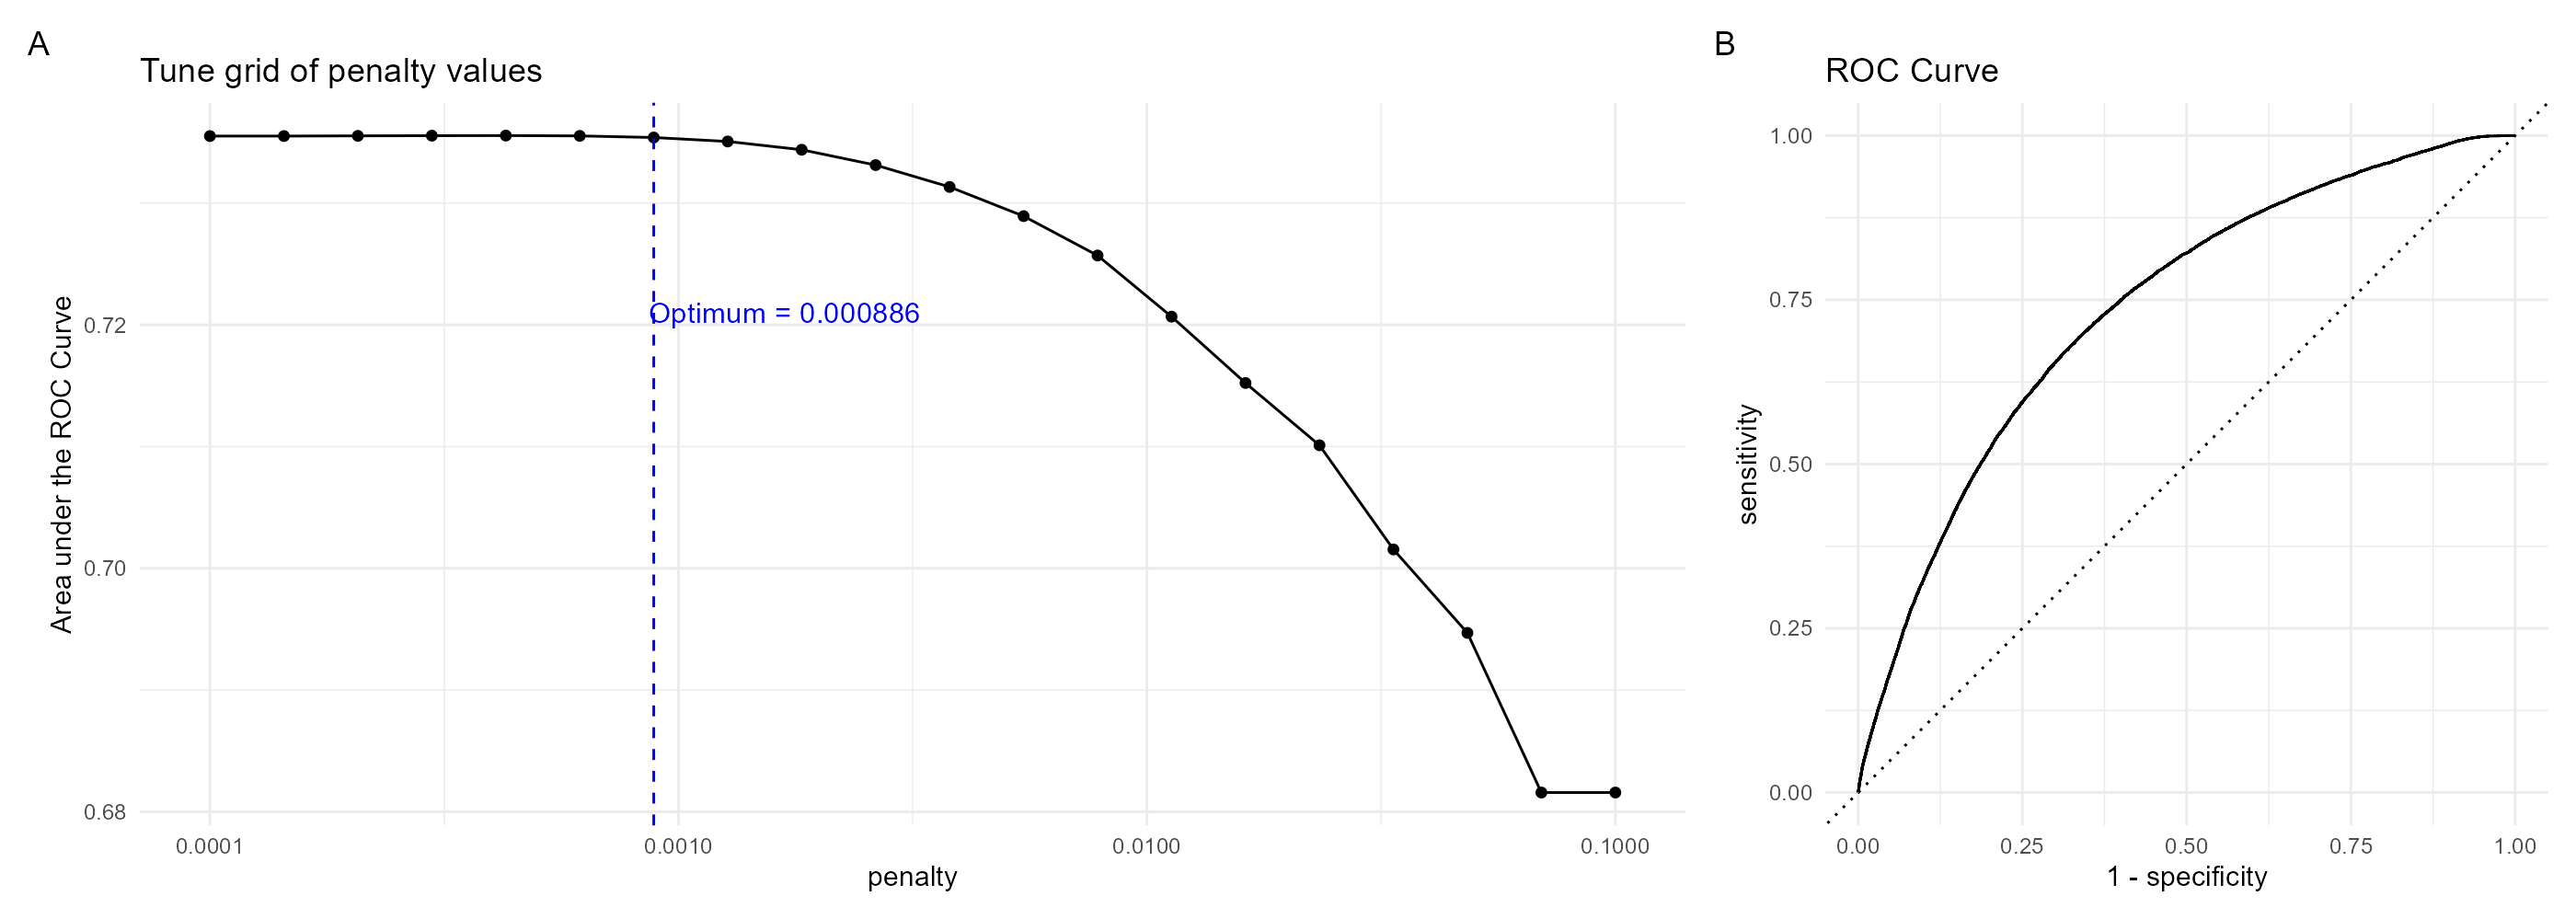
Folds were trained with logistic regression using the glmnet package. The LASSO lambda hyperparameter was tuned with a sequence of twenty possible penalty values from 0.0001 to 0.1 ( Figure 4 A). The highest training AUROC was 0.7373394 averaged across each fold, with a 0.000428 penalty. ROC curve is presented in Figure 4 B.
The model was then refit on the training data with this penalty score, and tested with the testing set. The model outputs probabilities of 90-day dropout event following the observed visit.
While discrimination is acceptable at 0.74 AUROC, the general performance is not exceptional. At a 0.5 probability cutoff, the precision is 0.56 and sensitivity (recall) is extremely low at 0.2.
The is may due to a class imbalance of the dropout outcome, which skewed predicted probabilities towards zero. While 25% percent of all visits experience dropout event, only 9.5% of predicted probabilities were above 0.5. As seen in Table 2, lowering the threshold to .38 produces more balance between precision and sensitivity to 0.5 and 0.48, respectively, at a slight expense of accuracy (0.75 to 0.74).
| cutoff | accuracy | precision | sensitivity | f_meas | j_index | roc_auc |
|---|---|---|---|---|---|---|
| 0.38 | 0.741 | 0.504 | 0.477 | 0.491 | 0.311 | 0.742 |
| 0.50 | 0.751 | 0.564 | 0.204 | 0.300 | 0.148 | 0.742 |
Table 2: Model Performance Metrics
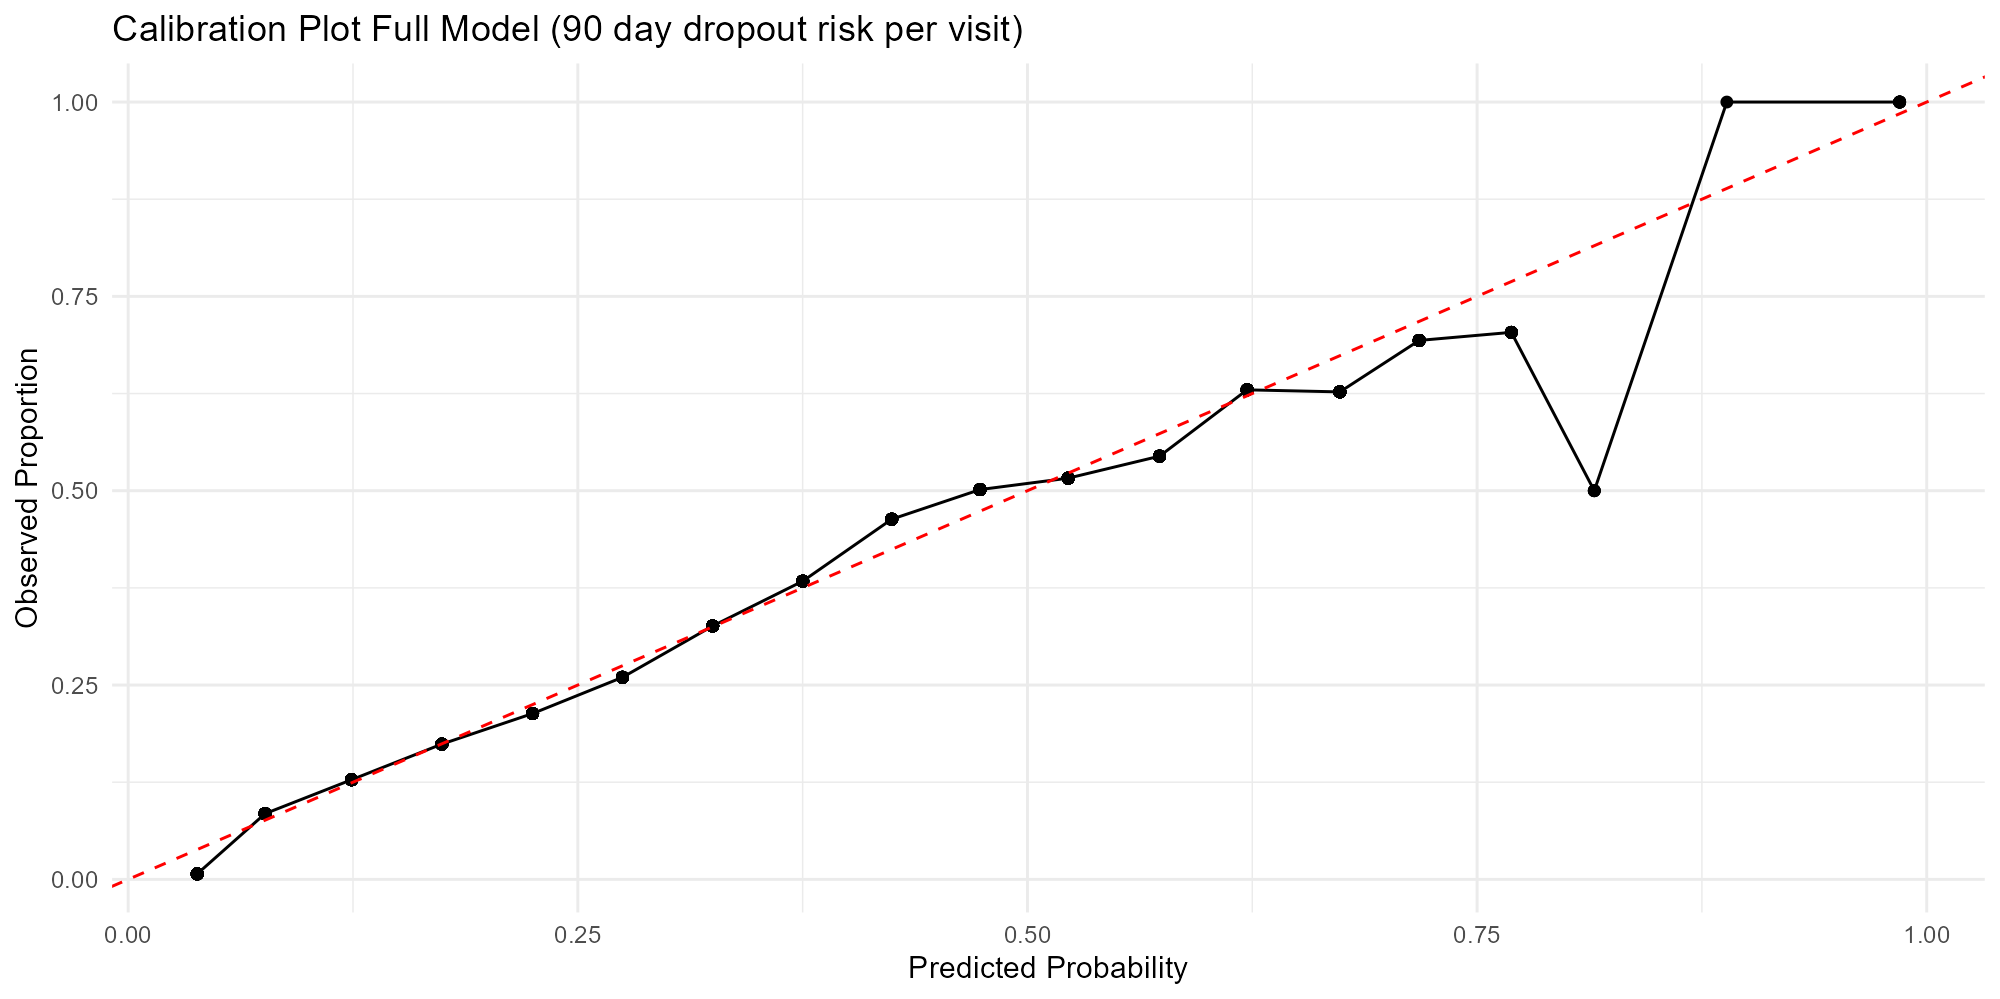
A calibration plot in Figure 5 shows the distribution of predicted probabilities and observed proportion of dropout events for 0.5 cutoff, segmenting probability levels into 20 groups. The model is fairly well calibrated up to 0.8 probability, but probabilities over 0.7 should be interpreted with caution, as 0.06% of predictions are above that level.
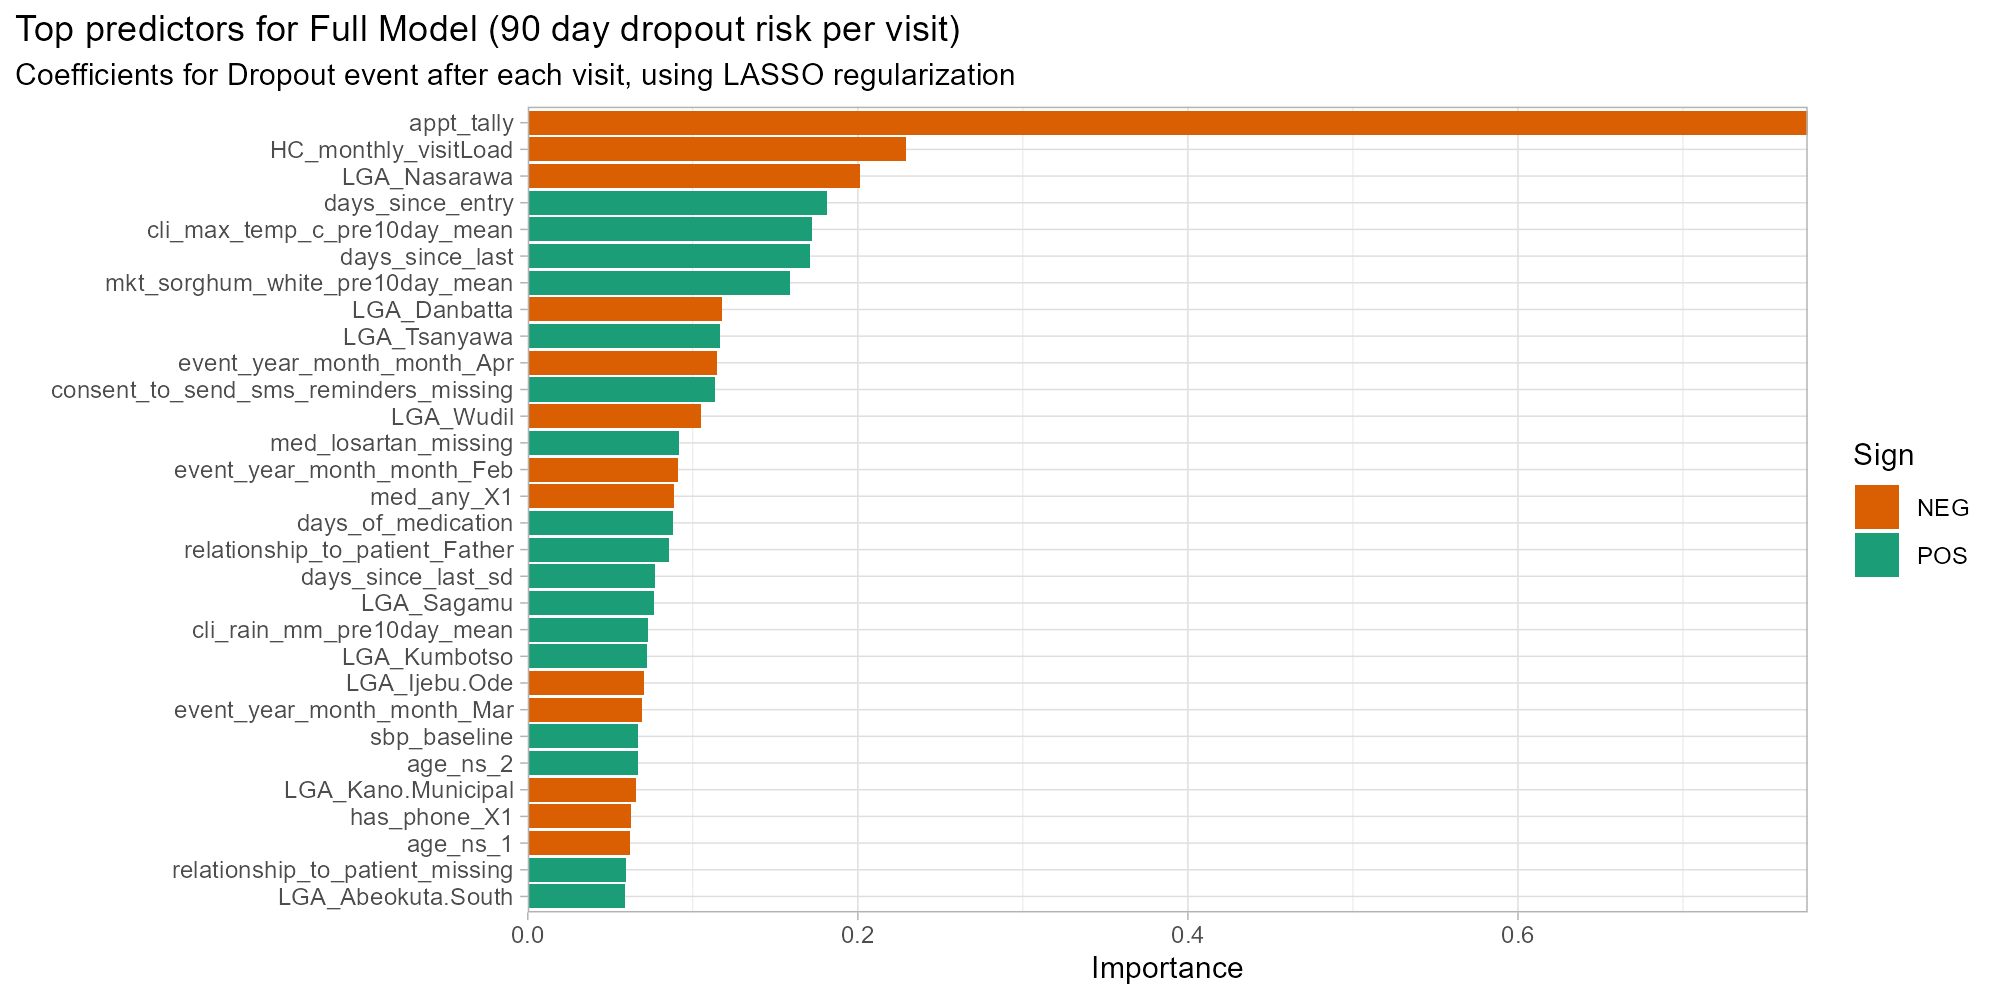
We earlier observed a clear descending pattern in the frequency of patients with x total visits. Examining coefficients of the per-opportunity dropout model underscores that appointment tally (count of total patient visits to date) is by far the most critical asset to predict dropout. The variable importance plot in Figure 6 shows the absolute value of coefficients after LASSO regularization. The coefficient for log of appointment tally is -0.8, four times higher than the next predictors, and aligns with the finding that rates of dropout decline with subsequent visits. This is balanced by the positive coefficients for days since previous visit and days since the first visit: all other predictors being equal, a longer gap between previous visits leads to a higher predicted probability of dropout.
Geographic location, defined by the LGA of visit, plays a key predictive role in this model (9/30 top predictors are LGAs), as well as characteristics of the health centre. Higher monthly throughput at the health centre was associated with fewer dropouts in this model. Higher temperatures and higher sorghum prices during the “timely visit” window (27-36 days after last) also had higher coefficients, potentially as they are correlated with seasons and health centre locations.
Interestingly, clinical variables are of more limited importance, with several being eliminated through LASSO regularization. Overall 14 out of 114 coefficients were shrunk to zero.
As shown in Table 1 , the patient population is unevenly distributed by Sex and State of clinic. Three quarters of patients are females, but males are more likely to dropout after first visit. Further, while 57% of all patients are registered in Kano state, 59% of patients who fail to return after baseline are from Ogun State. More dropout events thus occur in the minority groups, Ogun and Males.
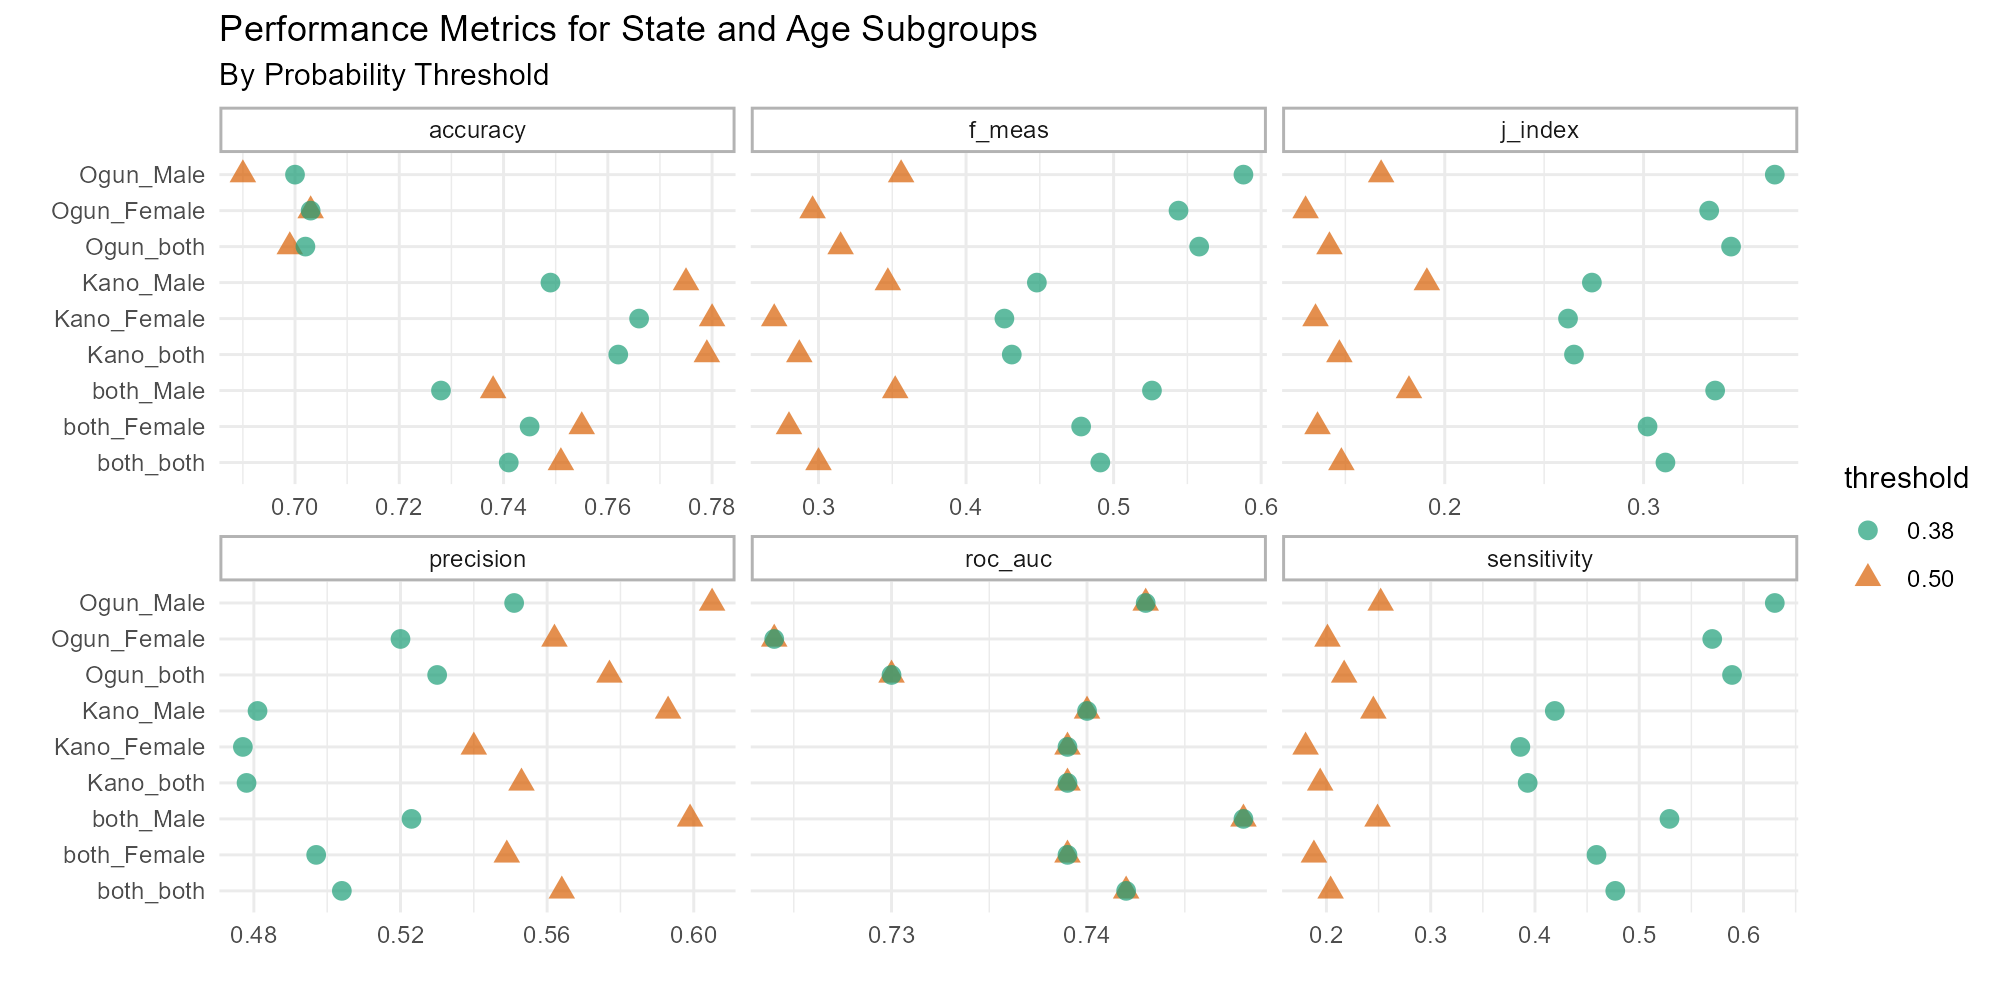
To assess model performance by subgroups, the above metrics were recalculated for each combination of Patient State, Patient Sex, and Decision Threshold (Figure 7, full table in Appendix A). In line with the state-level imbalance, we see that accuracy in Ogun is generally lower, with males specifically below 0.70 accuracy at both thresholds, but above 0.78 for Kano females at 0.38 threshold. The gap in precision between 0.38 and 0.50 thresholds for Males in Kano is roughly twice as large as for other subgroups. We can thus infer that there are disproportionately more true positive dropout predictions for Kano males between the 0.38 and 0.50 probability thresholds than other subgroups. Furthermore, the gap in sensitivity (recall) between thresholds is twice as great in Ogun as in Kano, meaning that proportionally more true positives in Ogun are found within this range than in Kano.
This paper has demonstrated development of a dropout risk prediction model with adequate discrimination in the large (AUROC=0.74) based on a slim clinical record, supplemented by data on external conditions at the time and location of each patient visit. As a longitudinal model predicting probability of dropout-per-opportunity, the training, validation, and test data were segmented based on patient ID, rather than date of visit. This presents a high likelihood of over-fitting in particular on time-variant data, such as temperature and sorghum prices, but controlling for repeated patient characteristics was considered more important. We note all climate and economic candidate predictors had modest effect sizes on 38 day dropout. Nonetheless, the size of the coefficients remaining through LASSO is surprising, and suggests over-fitting.
Ultimately this model should be judged by its utility and applicability in an implementation context. Vickers et al have described net benefit (NB) as a “simple type of decision analysis, with benefits and harms put on the same scale so that they can be compared directly”. [25] NB is defined as a function of true positives over n, minus false positives over n multiplied by the probability threshold used for the treat/not-treat decision (which is equivalent to a subjective “exchange rate” of the benefits of true positive vis-a-vis harms of false positive).

In this context, an intervention to support a patient when their latest visit was a “high risk” might be given priority for an outreach phone call or an automated SMS reminder. Such treatments have relatively low costs, so a low threshold may therefore be preferred. On test dataset, at pt=0.38, the NB value is 0.05. At pt=0.2 (where there are 1.5 times as many false positives as true positives) the NB is 0.12.
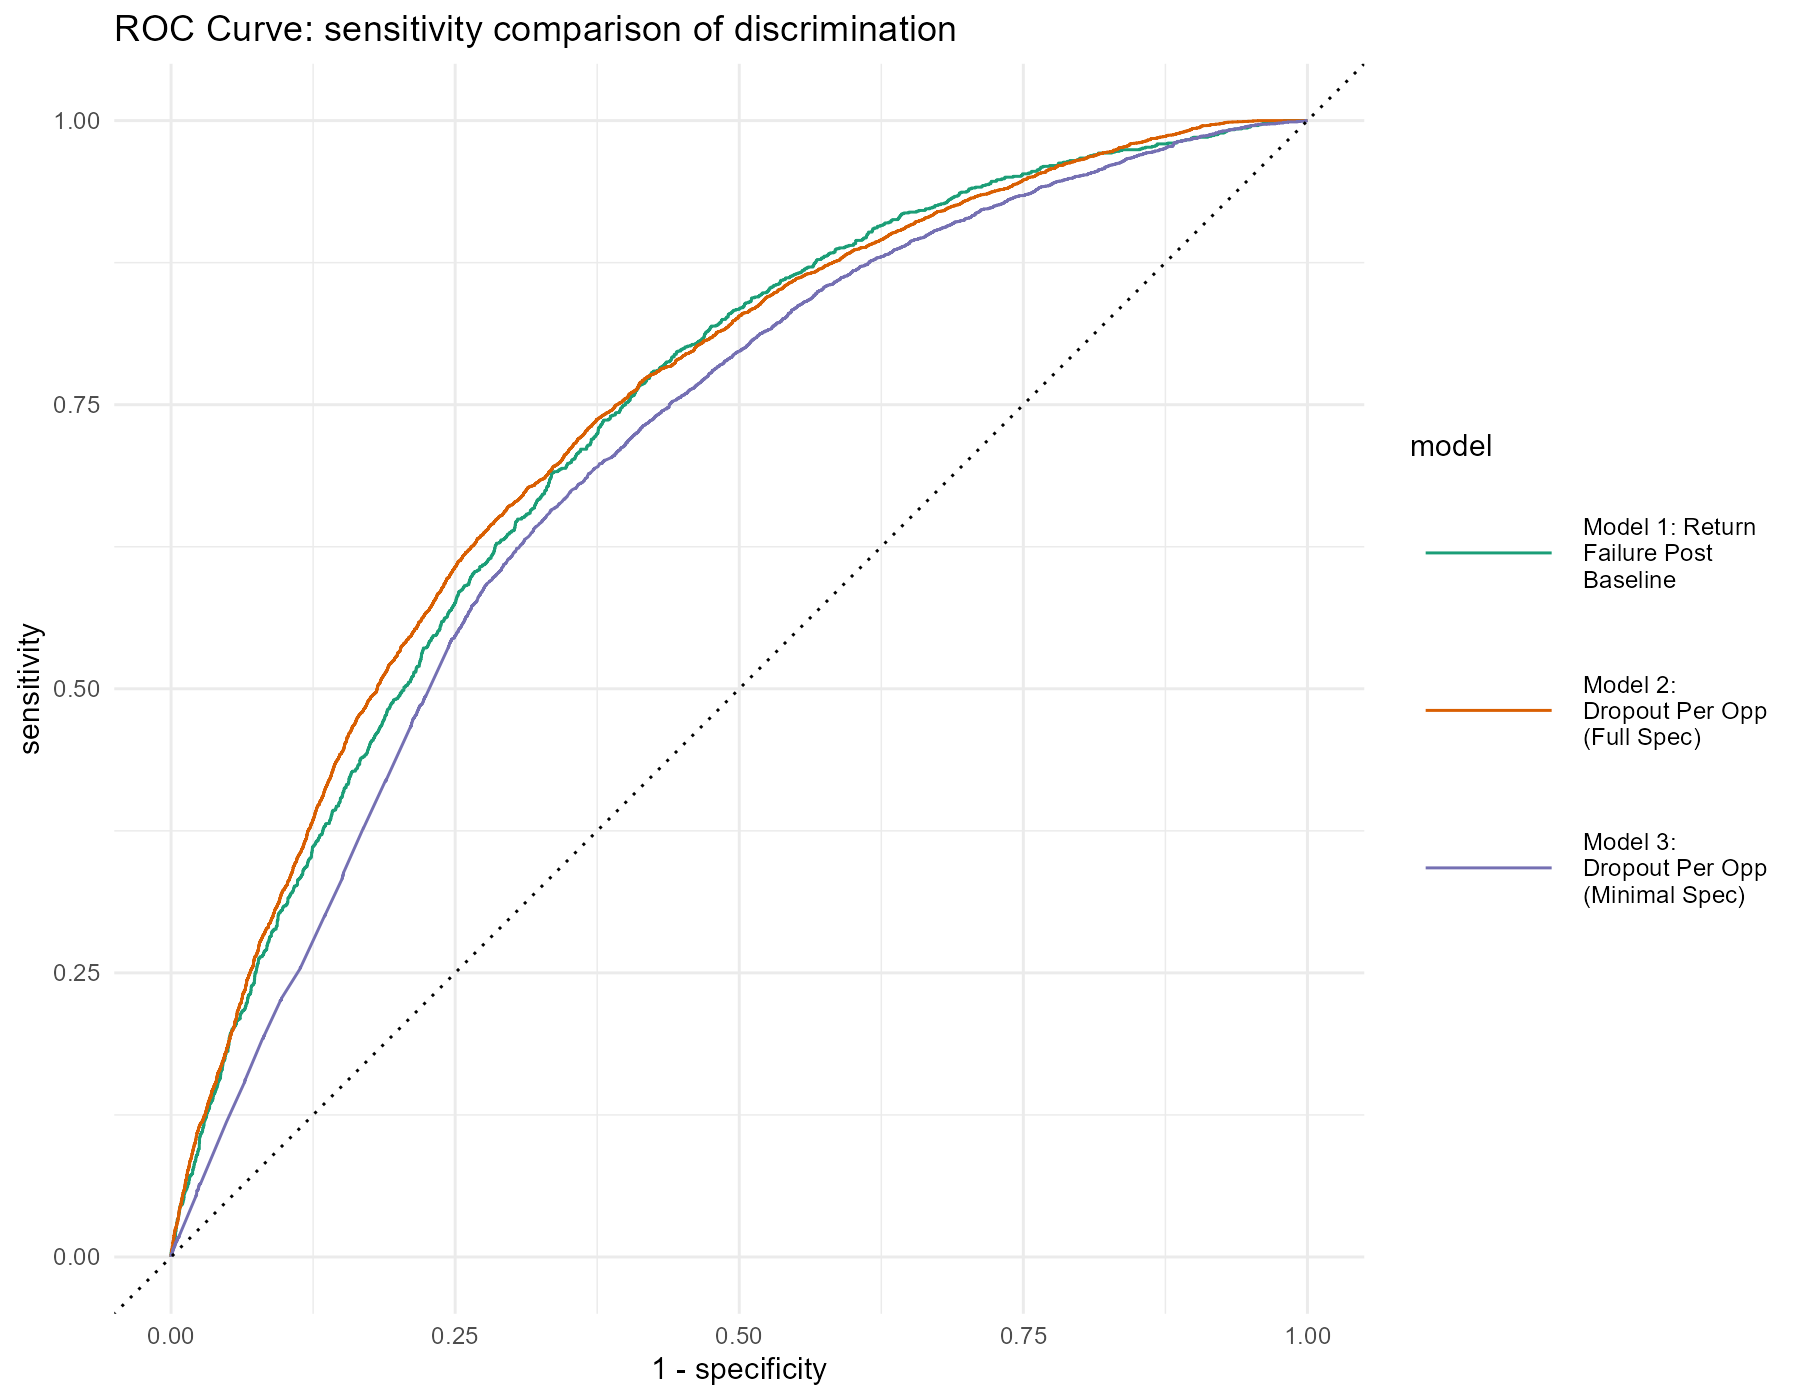
This model requires substantial processing of input data in order to output predicted value. As a model with marginal net benefit and likely over-fitting, the value of this model should be compared to relatively simple formulations that are also more generalizable. In a sensitivity analysis, we followed the same steps as developing the Full Model above, but with two separate pathways. First, only baseline level variables were included, and the outcome was reformulated as “Return Failure” after first visit. In addition, we tested a “miniature model” for dropout-per-opportunity which only included inputs derived from patient ID and visit dates (appointment tally, days between visits, days since entry, month of visit).
These models are compared by ROC curve in Figure 8 and by performance metrics in Table 3.
| model | accuracy | precision | sensitivity | f_meas | j_index | roc_auc |
|---|---|---|---|---|---|---|
| Model 1: Return Failure At Baseline | 0.756 | 0.494 | 0.313 | 0.383 | 0.211 | 0.735 |
| Model 2: Full Spec | 0.741 | 0.504 | 0.477 | 0.491 | 0.311 | 0.742 |
| Model 3: Minimal Spec | 0.703 | 0.438 | 0.487 | 0.461 | 0.266 | 0.704 |
Table 3: Sensitivity Comparison Metrics, Decision Threshold=0.38
At a 0.38 decision threshold, the full model (Model 2) generally outperforms the others, except for Accuracy against Model 1 and Sensitivity against Model 3. From here, the optimization approach depends on problem formulation, target outcome, and feature specification. But the closeness of key metrics across models suggests that subtracting variables would improve generalizability without much expense to accuracy, precision, or discrimination.
There may also be an argument for more advanced machine learning techniques often performed on high-dimensional EMR data, such as random forest or k-nearest neighbors. In particular, the logistic regression model did not account for patterns in repeated measures across a patient’s visits, such as medications or blood pressure, which may be better assessed with such techniques. We note however that a systematic review of clinical risk prediction models found zero gain in AUROC for machine learning methods compared to logistic regression. [26] The plausible gains from a machine learning approach must be weighed against the low Net Benefit of a baseline logistic regression, the dangers of additional over-fitting, and the challenges of maintaining such computationally expensive models in this context.
Subsequent studies should undertake a causal investigation of factors with high coefficients in this model, such as days of medication, supporter role, consent to SMS, and clinic characteristics (e.g. its LGA or monthly throughput) . They should also study other variables which were not available for this analysis but have previously been found to affect patient dropout, such as patient distance to clinic, socioeconomic status, price of treatment, comorbidities, and attitude towards health. Causal factors could be then incorporated into the EMR to support more precise dropout prediction models.