DHIS2 User Activity Analysis
Analyzing user-level tracker data for https://hrhr.dhis2.org/dhis/.
Description
DHIS2 keeps a log of every entry of a data element into a tracker program at the audits/trackedEntityDataValue API endpoint, including username and timestamp. From these data, we can analyze user interactions with tracker data elements, referred to as edits in tables below. For more details on the tracker audit log, see the DHIS2 developer guide.
The selected date range for analysis is between 2017-01-01 and 2019-09-30.
First, we check to see that the provided log in is valid.
## [1] "successfully logged in"We’ve now pulled audit log and some metadata from API.
The TrackedEntityDataValue table shows 23211 UPDATES and 3825 DELETIONS.
An update may be a new data value being entered into a stage, or editing an existing value. A deletion is an erasure of an existing data value. For simplicity tables below refer to updates and deletions together as edits.
This table shows all users who entered tracker data by number of deletions and updates. You can expand the table, or search for a given user.
Now, we can merge audit data with other metadata.
Who Uses This Tracker System?
We have merged the tracker audit data with other user information stored in DHIS2.
The audit log shows 23 unique program stages with data, entered by 32 unique users.
Overall, 64 users have accounts, and 63 have logged in at least once. (Note: some users may have been deleted since they entered tracker data.)

Distinct Tracker Users by Hour
On average, how many users enter tracker data every hour of the day? This should give a sense of “concurrent users” and server load during the work day.
Note: The charts below show mean distinct users entering tracker data in each date-hour. If a given date did not have more than one user enter tracker data, the date is excluded. Also note, the server timestamp is currently 0:14, while the local time of report analysis is 2:14.
During the analysis period, the daily peak period is 9 hours. On a typical workday, 0.61 users are entering tracker data at that hour.


Tracker Edits by Stage
We now merge with program stage data to understand which program stages show the most frequent edits.
Program stages are listed below, by decreasing order of overall edits.
Heat Map of Stage and Hour
The distribution of stage edits by hour are displayed below in a heat map by stage and hour that TEI edits were recorded. This graphic focuses on the top 20 stages by number of edits– all remaining stages are grouped as “OTHER”

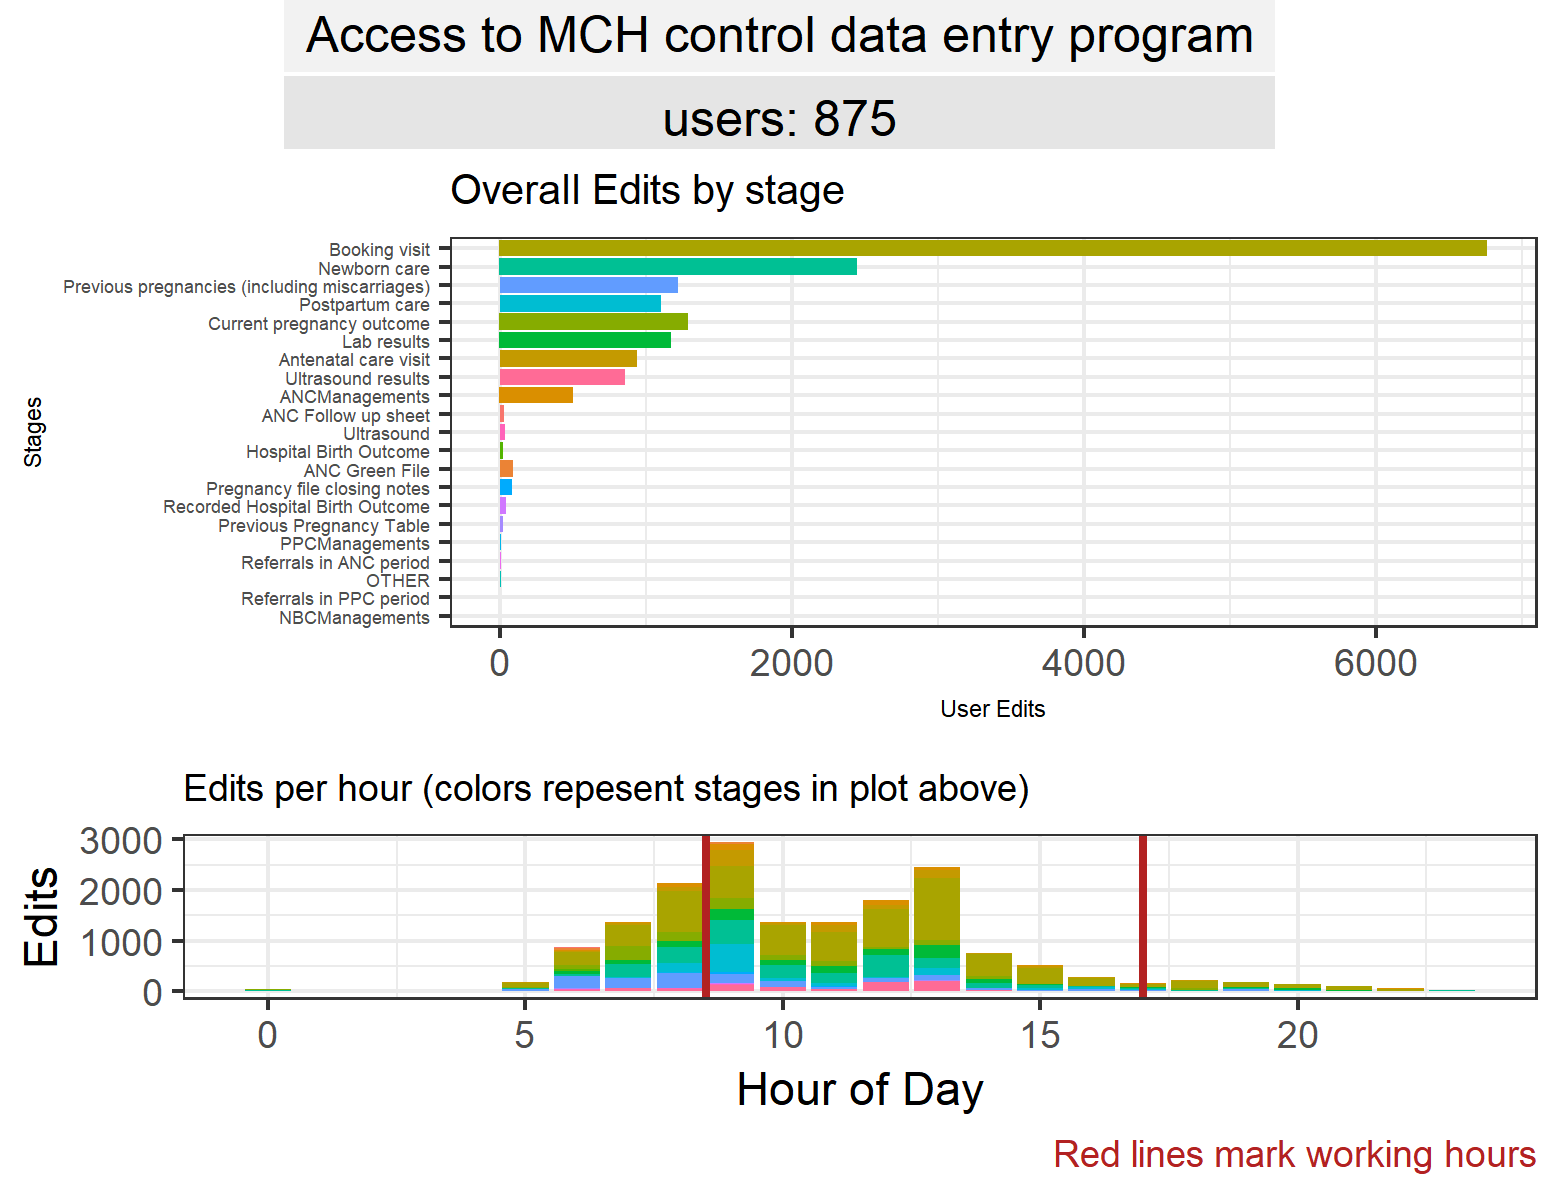
Tracker Audit Charts By Stage and Hour
The figure below shows edits by stage, for all users. The following figure shows edits by stage and hour, for all users. These graphics are reproduced for each user and user group in subsequent sections.


Time Series Charts
The following plot shows all tracker data “edits” during the selected time period. Click and drag over a period to zoom in, and double click to zoom out. Scroll over a time period for edits and date.
An exploration by day of week and time edits occurred. 
Users and User Groups
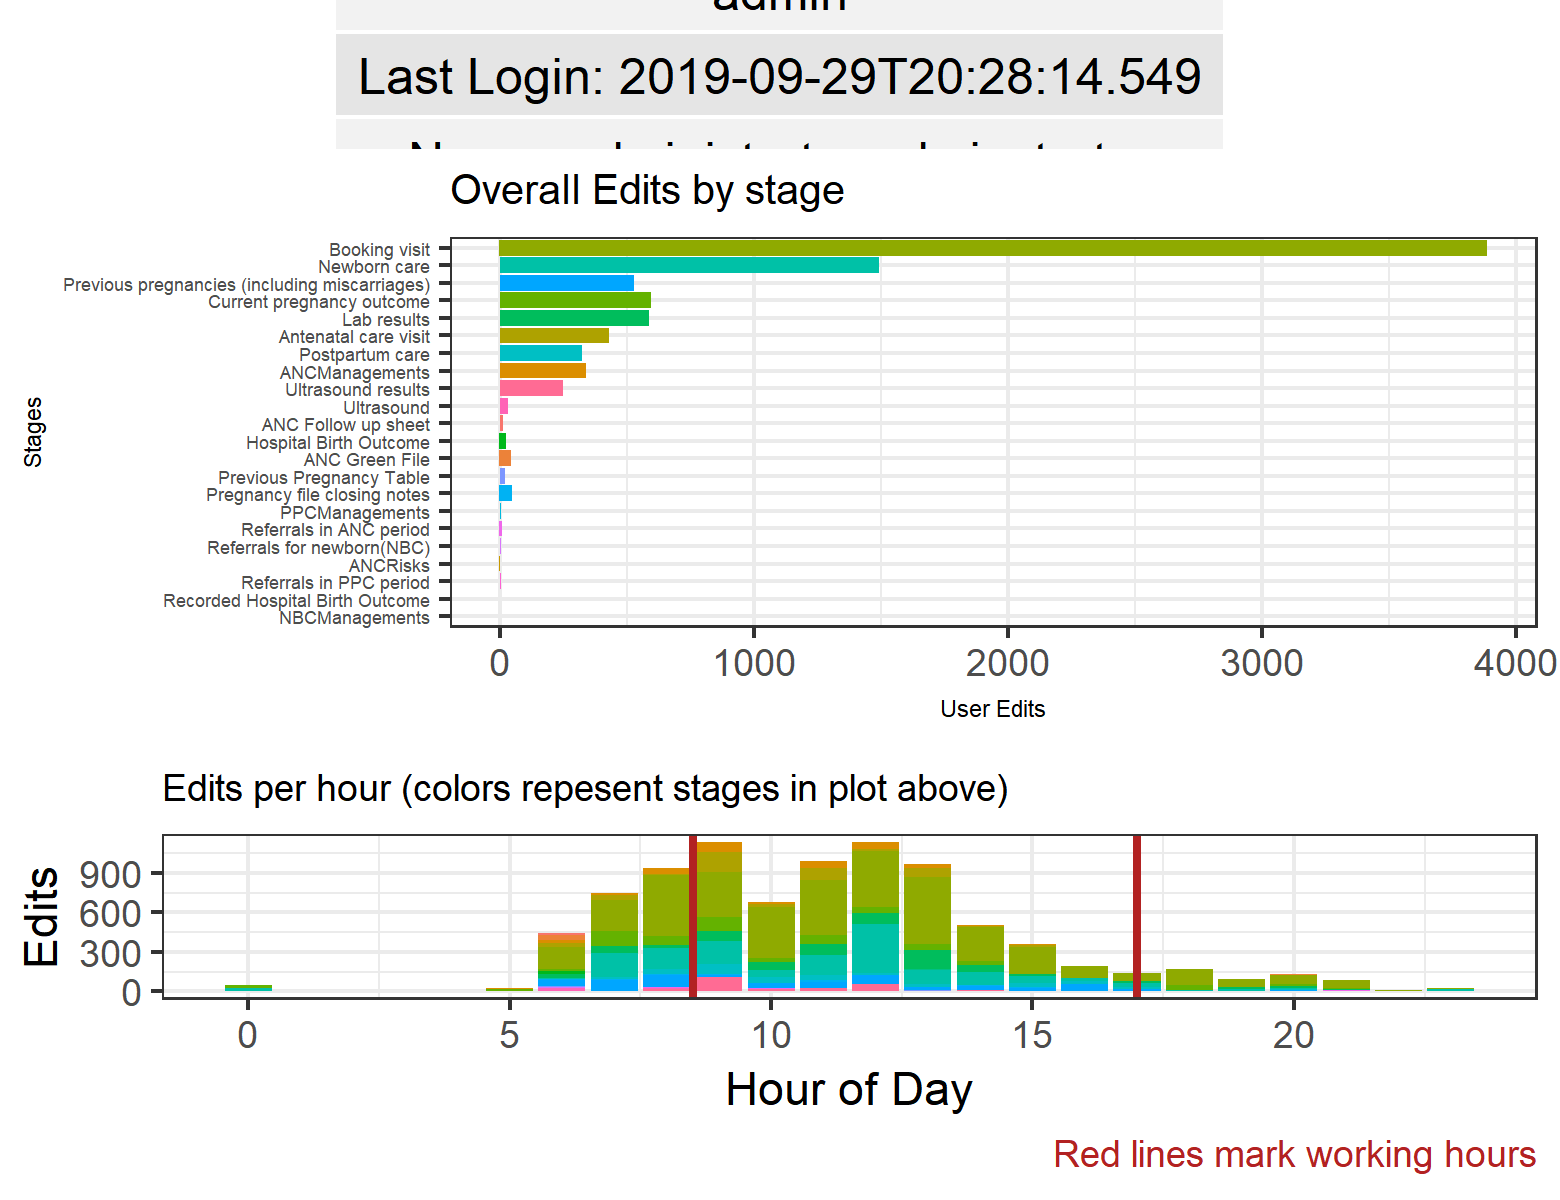
Tracker usage patterns can look very different when down to the user level.
On the left is a typical user ( kjersti ) who had many tracker interactions within work hours, and on the right is a user ( Khadija ) who had comparitively few interactions during work.


User Groups
In total, 9 different user groups have entered tracker data.
Graphs showing top stages by hour for each user group are found at directory C:/Users/Brian/Documents/GitHub/dhis2-user-analysis E.g. at C:/Users/Brian/Documents/GitHub/dhis2-user-analysis/plots/usergroups
Below are the user groups with the most user interactions (“edits”) in tracker. Click the selector box to find a certain uesr group.
Graphs showing top stages by hour for each username are found at directory C:/Users/Brian/Documents/GitHub/dhis2-user-analysis/plots/users
Individual Users
Below are the usernames with the most freqent user interactions (“edits”) in tracker.
“Sessions” and Users-Per-Event
In this section, we convert the TEI audit log to show time between first and last auditted change. It can be useful to use session duration as a proxy for data entry speed to give a sense of data quality.
We define a “session” as one or more auditted changes to an event by a single user in a calendar month. The session length is the length of time spent on this event in seconds.
Bubble Chart of Tracker Sessions
The next section considers each stage by median session duration, number of sessions, and number of overall edits.
For clarity, only stage-sessions of 1-10 minutes in length are analyzed, and only the stages in the top 10 session count are plotted.
Session Duration by Users
We can get the same details by user. A user with sessions that are too long may require more training.
Events With Multiple Users Submitting Data
Here we get a simple listing of events where multiple users editted the same stage.
In total, 36 events had multiple users submit data within the selected period. This may suggest evidence of data tampering!
By clicking on any event ID link, you can browse the API for more details.
End Analysis
Time to complete analysis: 57.951 seconds
This analysis could be supplemented with additional user-level data, derived from every trace of a user interaction with DHIS2. These might involve…
- Metadata changes by users (dashboard creation, etc)
- Supplemental notes entered by users, and “breaking the glass” audit logs
- User-level audit logs of aggregate data entry and TEI registration (attributes data entry)
- User engagement with analytics, through dashboard views and interpretations


Institutional affiliations
Additional RMarkdown styles and options available at the RMarkdown website. More options for interactive HTML widgets are available here.
Template document produced by Brian O’Donnell for the eRegistries Initiative at the Norwegian Institute of Public Health.